Process plants, utilities, fleets, and industrial facilities generate enormous volumes of time-series data across historians, SCADA systems, PLCs, DCS, IoT devices, spreadsheets, lab systems, and legacy software.
But when that data is fragmented, teams are left dealing with:
Before you can scale AI, predictive maintenance, or remote operations, you need an industrial data foundation that can scale with your operations.
DataHUB+ was built for exactly that.

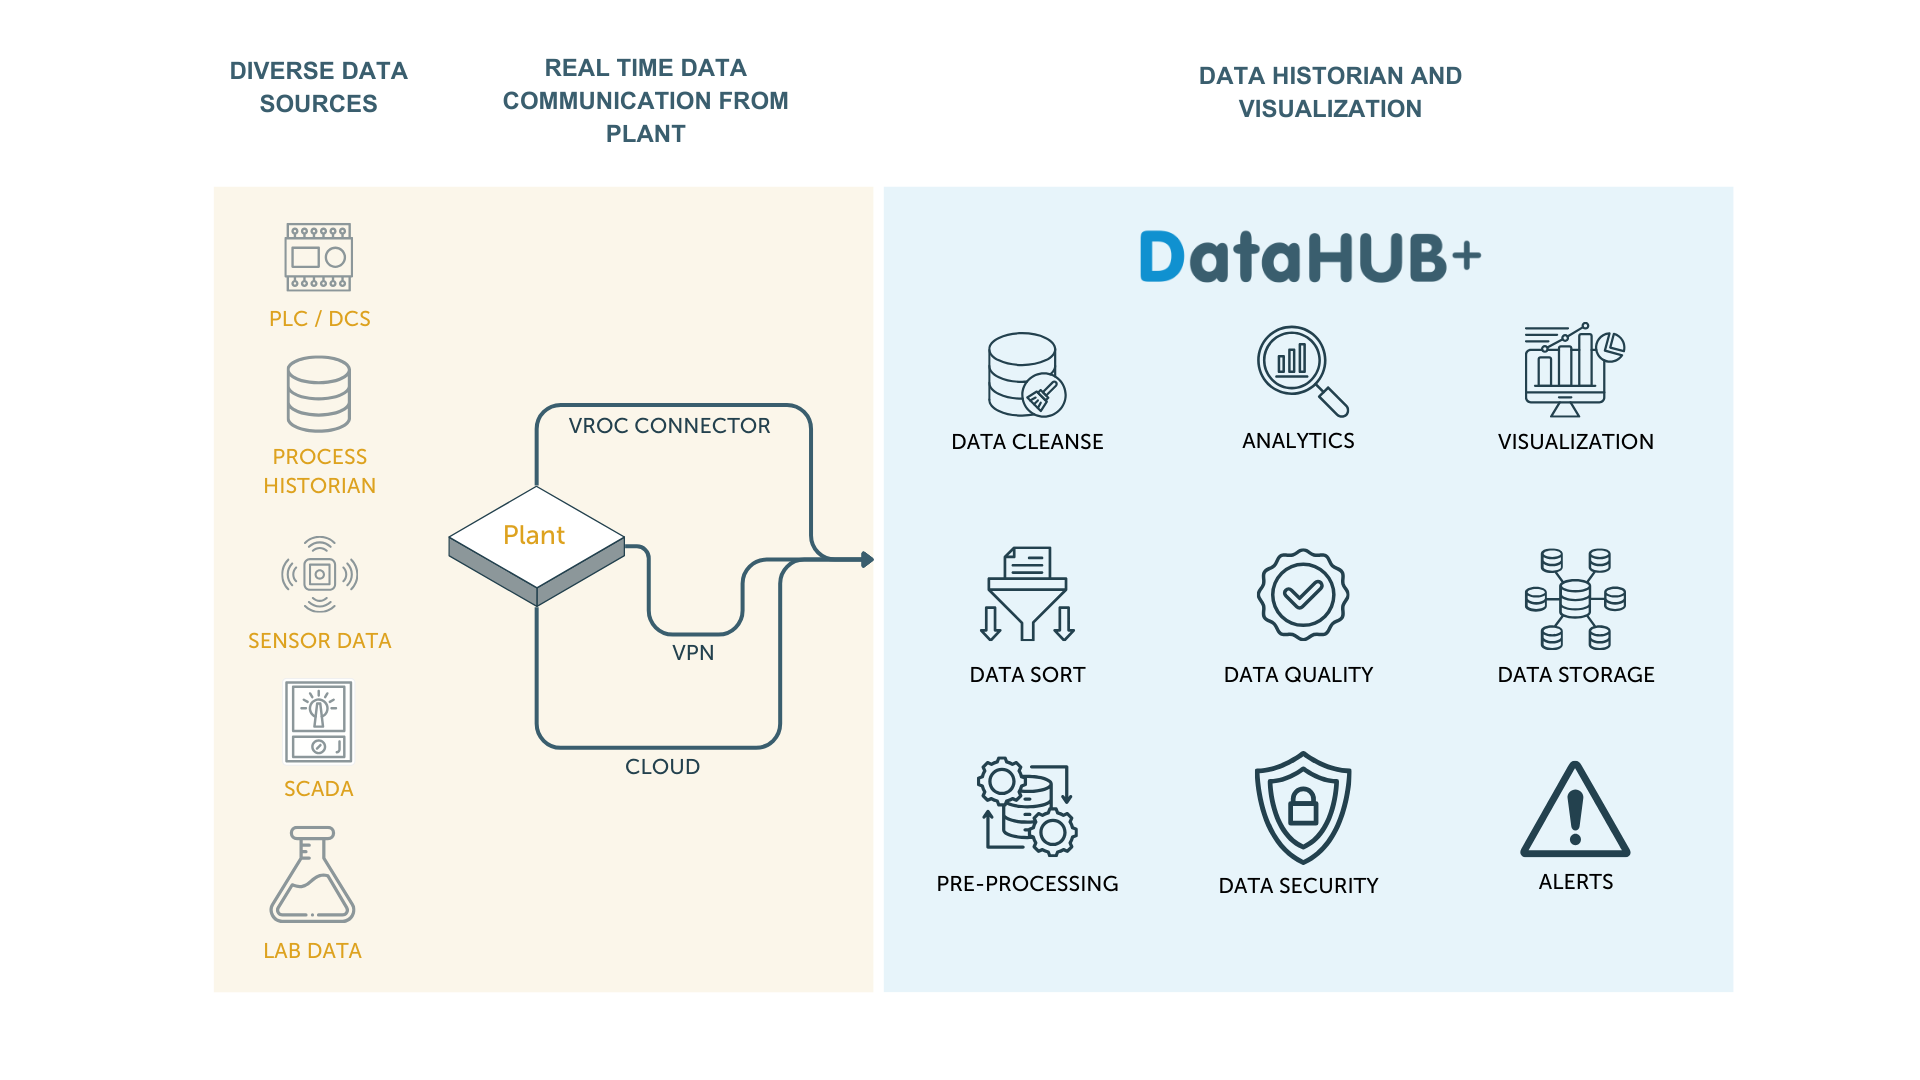
DataHUB+ is VROC’s enterprise industrial data historian and visualization platform, built to collect, store, standardize, and analyze high-volume time-series data across assets, sites, and systems.
It can connect to existing historians or replace legacy historian environments entirely, creating a single, governed, AI-ready source of truth for operational data.
Designed specifically for asset- and process-intensive industries, DataHUB+ supports fast data ingestion, scalable storage, real-time visualization, and enterprise-wide access — helping teams move from disconnected data to connected operational intelligence.
It is not just a place to store data. It is the foundation for real-time monitoring, performance analysis, remote operations, and industrial AI.
Store and manage vast volumes of high-frequency time-series data across assets, processes, plants, fleets, and facilities.
Connect historians, SCADA, PLCs, IoT gateways, cloud systems, and third-party tools into one structured environment.
Automated validation, tagging, standardization, and version control ensure trusted, audit-ready data.
Serve clean, contextualized time-series data directly into predictive maintenance, anomaly detection, and optimization models.
On-premise, cloud, or hybrid — designed to meet operational and cybersecurity requirements.
Move beyond static reports and delayed analysis with real-time visibility across critical assets, processes, and sites.
Unify operational data from multiple assets, plants, facilities, or remote sites into one trusted view.
DataHUB+ helps teams monitor performance across the enterprise, compare operating conditions between sites, track production or service delivery KPIs, and identify areas that need attention.
Ideal for: oil and gas operations, water utilities, maritime fleets, defense infrastructure, manufacturing facilities, and multi-site built environments.
For organizations managing remote, hazardous, or geographically dispersed assets, DataHUB+ provides centralized visibility across the operating environment.
Teams can monitor equipment, facilities, vessels, treatment systems, production assets, or infrastructure from regional control centers, head office, shore-based teams, or remote operations centers.
Ideal for: offshore oil and gas, water treatment networks, remote pump stations, maritime operations, defense bases, radar sites, communications infrastructure, and distributed energy assets.
DataHUB+ gives teams a live view of asset and process conditions, helping them monitor equipment health, detect changing behavior, and investigate performance issues earlier.
By bringing sensor, control system, and historical data into one platform, teams can track operating parameters such as pressure, temperature, vibration, flow, energy use, throughput, and availability.
Ideal for: compressors, pumps, generators, turbines, treatment assets, vessels, production lines, HVAC systems, and critical infrastructure.
Process engineers need fast access to reliable data to understand what is happening, what has changed, and where performance can be improved.
DataHUB+ supports real-time and historical analysis of process conditions, production efficiency, energy performance, quality indicators, environmental metrics, and operating windows.
Ideal for: oil and gas processing, water treatment, manufacturing, chemicals, energy, and other process-heavy operations.
DataHUB+ helps organizations track the operational metrics that matter most, from individual equipment performance through to enterprise-level KPIs.
Teams can visualize production targets, asset availability, equipment efficiency, energy performance, emissions indicators, water quality metrics, maintenance performance, and other business-critical measures.
Ideal for: executive reporting, operations reviews, compliance tracking, ESG visibility, asset performance management, and continuous improvement programs.
Most industrial environments are not starting from scratch. They operate with a mix of legacy systems, modern platforms, site-specific tools, and disconnected data sources.
DataHUB+ is designed to work with existing infrastructure, helping teams unify data from PLCs, DCS, SCADA, process historians, IoT sensors, lab systems, maintenance platforms, and enterprise systems without needing to rip and replace everything already in place.
Ideal for: brownfield plants, aging infrastructure, mixed-vendor environments, legacy historian modernization, and industrial data consolidation projects.
Reliable industrial AI depends on reliable operational data.
DataHUB+ helps collect, store, organize, and contextualize the time-series data required for predictive analytics. When connected with OPUS, teams can move from monitoring what has happened to predicting what is likely to happen next.
This supports advanced use cases such as early degradation detection, time-to-failure prediction, deviation management, anomaly detection, and AI-driven root cause analysis.
Ideal for: reliability teams, maintenance teams, asset managers, process engineers, and operations teams looking to move beyond threshold-based monitoring.
Unify operational data from wells, processing facilities, compressors, turbines, pumps, produced water systems, utilities, and remote assets. DataHUB+ helps oil and gas teams monitor asset health, production performance, energy use, emissions indicators, and reliability KPIs across upstream, midstream, and downstream environments. See Oil and Gas
Monitor distributed assets such as treatment plants, pump stations, reservoirs, dosing systems, filtration assets, and remote infrastructure. DataHUB+ helps water teams improve visibility, track process performance, support compliance, and build a stronger data foundation for optimization. See Water Management
Support operational readiness by consolidating data across bases, fleets, facilities, sustainment environments, energy systems, and mission-critical infrastructure. DataHUB+ helps defense organizations improve situational awareness, monitor asset condition, and reduce the impact of fragmented operational data. See Defense Solutions
Bring vessel, fleet, port, shore-side, and equipment data into a central operational view. DataHUB+ supports real-time monitoring, fleet performance visibility, maintenance planning, and shore-to-ship operational intelligence. See Maritime
Give teams faster access to production, quality, energy, and equipment performance data. DataHUB+ helps manufacturers understand variability, monitor throughput, investigate downtime, and identify opportunities to improve efficiency.
Centralize data from building systems, HVAC, meters, energy assets, sensors, and facilities infrastructure. DataHUB+ supports real-time visibility, energy performance tracking, and operational monitoring across complex or multi-site facilities. See Built Environment
Predictive maintenance, remote operations, performance optimization, and enterprise-wide analytics all depend on clean, connected, high-quality operational data.
DataHUB+ gives industrial teams the scalable historian, visualization, and data foundation they need to move from fragmented information to connected operational intelligence.
Gain real-time visibility, predict failure earlier, optimize performance, and take control of your operations with VROC’s integrated solutions.